Group Nguyen Krajewski others
Group members
- Khai Nguyen
- Hoang Bach Nguyen
- Ly Thai Hoa
- Miglio Krajewski
1. Analog and Digital Signals
Signals are used to transmit information between electronic components.
There are two main types of signals used in electronics: analog signals and digital signals.
Analog Signals – Continuous Wave
An analog signal varies smoothly and continuously over time.
It can represent an infinite number of values within a certain range.
Typical characteristics of Analog Signals
- Representation: Sine waves
- Continuous variation in voltage or current
- Can represent natural phenomena such as sound or temperature
Examples of analog signals:
- Human voice traveling through the air
- Traditional landline telephones
- Vinyl record audio playback
Pros/Cons
- Advantage: Very accurate representation of natural signals
- Disadvantage: Highly sensitive to noise and interference
Once noise is introduced into an analog signal, it is very difficult to remove it completely.
Digital Signals – Discrete Values
A digital signal represents information using discrete values, usually binary numbers (0 and 1).
Instead of varying continuously, the signal switches between fixed voltage levels.
Typical characteristics
- Representation: Square waves
- Binary format (0 or 1)
- Used in most modern electronic systems
Examples of digital signals include:
- Computers
- CDs and digital audio systems
- HDMI cables
- Fiber-optic communication
Advantages, Disadvantages
- Advantage: High resistance to noise and interference
- Disadvantage: If the signal becomes too weak, the data may be lost completely
Digital systems work using an all-or-nothing principle, where signals are interpreted only as logical HIGH or LOW.
Comparison of Analog and Digital Signals
| Feature | Analog Signal | Digital Signal |
|---|---|---|
| Waveform | Continuous (sine wave) | Discrete (square wave) |
| Data Representation | Voltage/current variations | Binary (0 and 1) |
| Noise Sensitivity | Highly sensitive | More resistant to noise |
| Storage | Physical media (tape, vinyl) | Digital storage (SSD, cloud) |
2. I²C Communication Demonstration with Time of Flight distance sensor
Setup
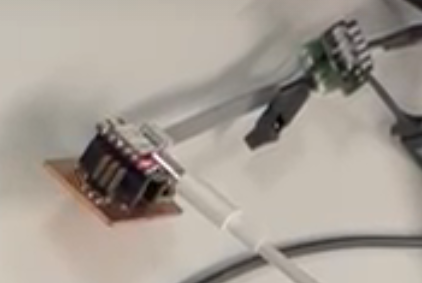
To demonstrate digital communication between sensors and a microcontroller, we used the following equipment:
- Time of Flight distance sensor
- PCB with microcontroller
- Oscilloscope and connectors
- Laptop
The microcontroller was programmed to read data from the Time of Flight distance sensor and output the measured acceleration values in millimeters on the console.
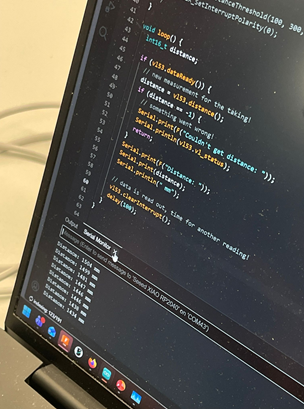
As you can see, the distance sensors pickup the measurements and announces every 100ms on the serial monitor:
`Distance: 1504 mm`
-100ms-
`Distance: 1499 mm`
-100ms-
`Distance: 1481 mm`
-100ms-
I²C Communication Protocol
The experiment demonstrates the I²C (Inter-Integrated Circuit) protocol, which is commonly used for communication between microcontrollers and sensors.
I²C uses two communication lines:
| Signal | Function |
|---|---|
| SCL | Clock signal controlling timing |
| SDA | Data line used to transfer information |
The clock signal (SCL) synchronizes the communication, while the SDA line carries the sensor data.
Oscilloscope Observation
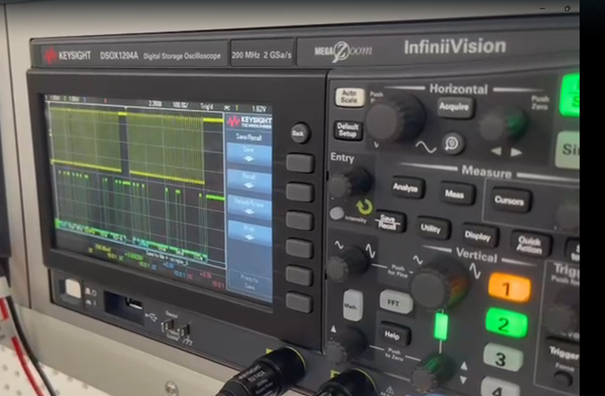
The signals were monitored using an oscilloscope connected to the PCB.
Two signals
- Clock signal (SCL): Yellow signal
- Data signal from the Time of Flight distance sensor (SDA): Green signal
The clock signal acts as a timing reference for the data signal.
Data is typically read when the clock signal is HIGH.
Certain longer clock intervals correspond to start and stop conditions, which mark the beginning and end of a data transmission.
3. Analog Signal Measurement with Light Sensor
Setup components
-
Light sensor (phototransistor)
-
PCB with microcontroller (Arduino-based)
-
Oscilloscope and connectors
-
Laptop for serial monitoring
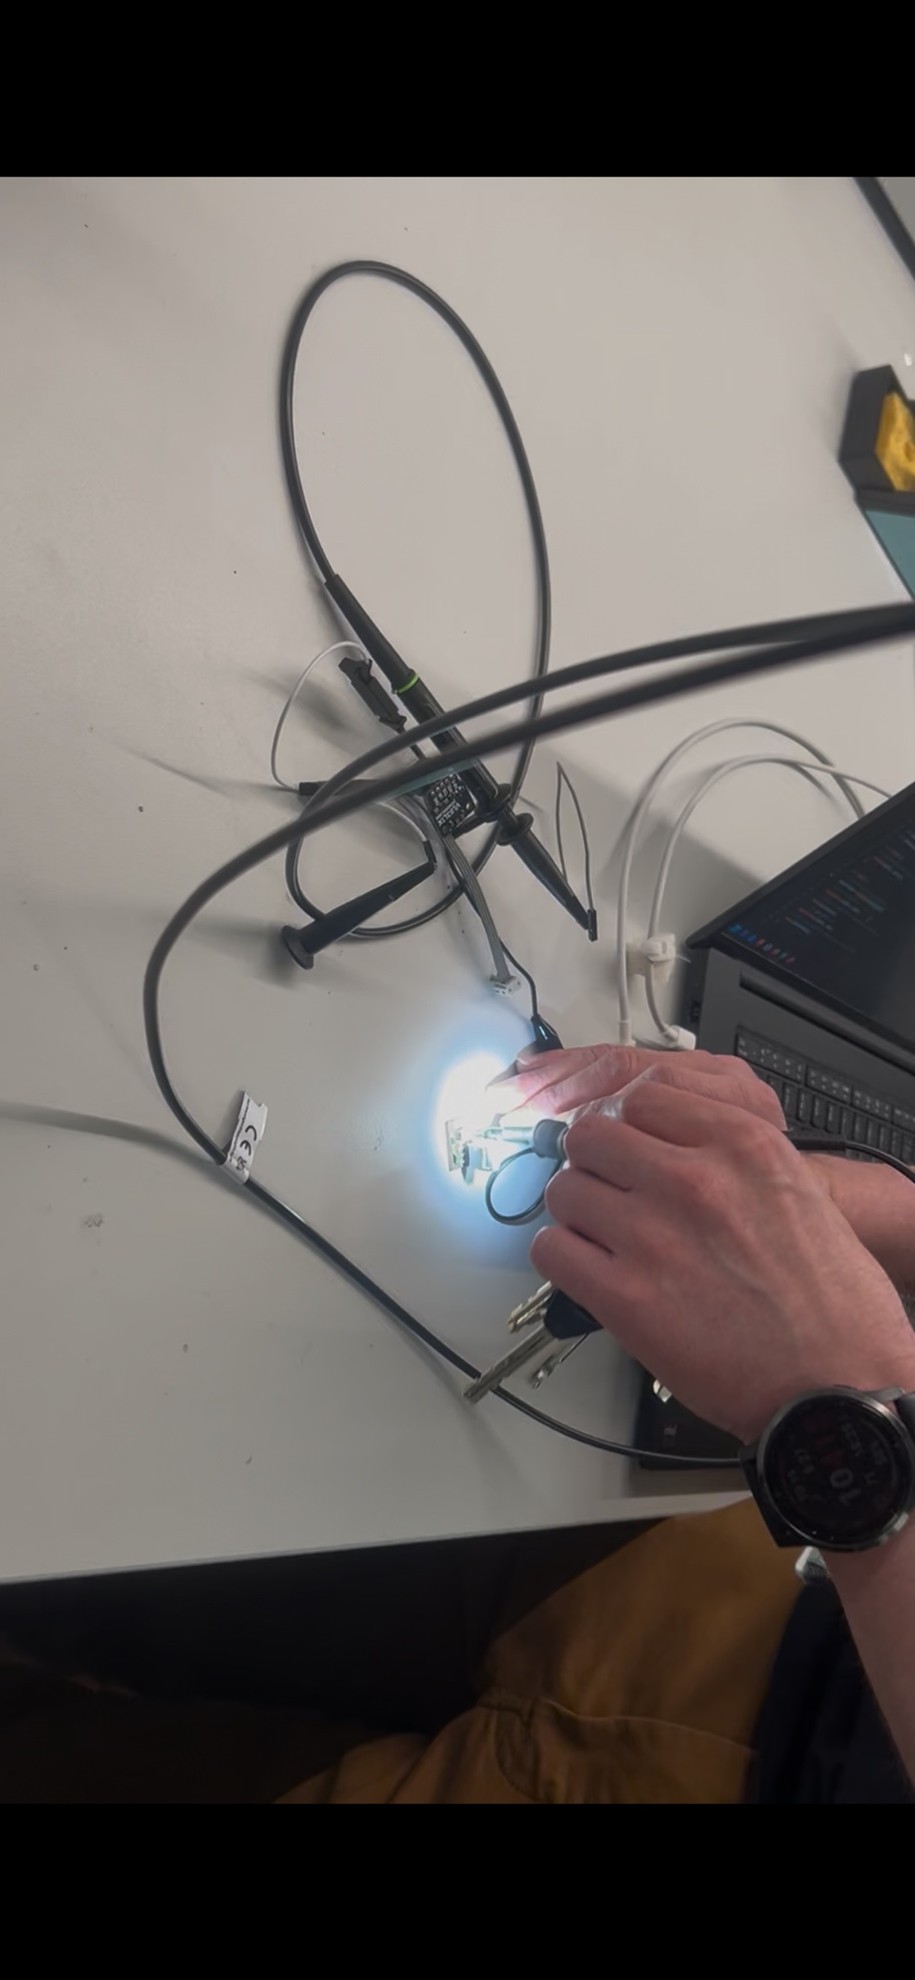
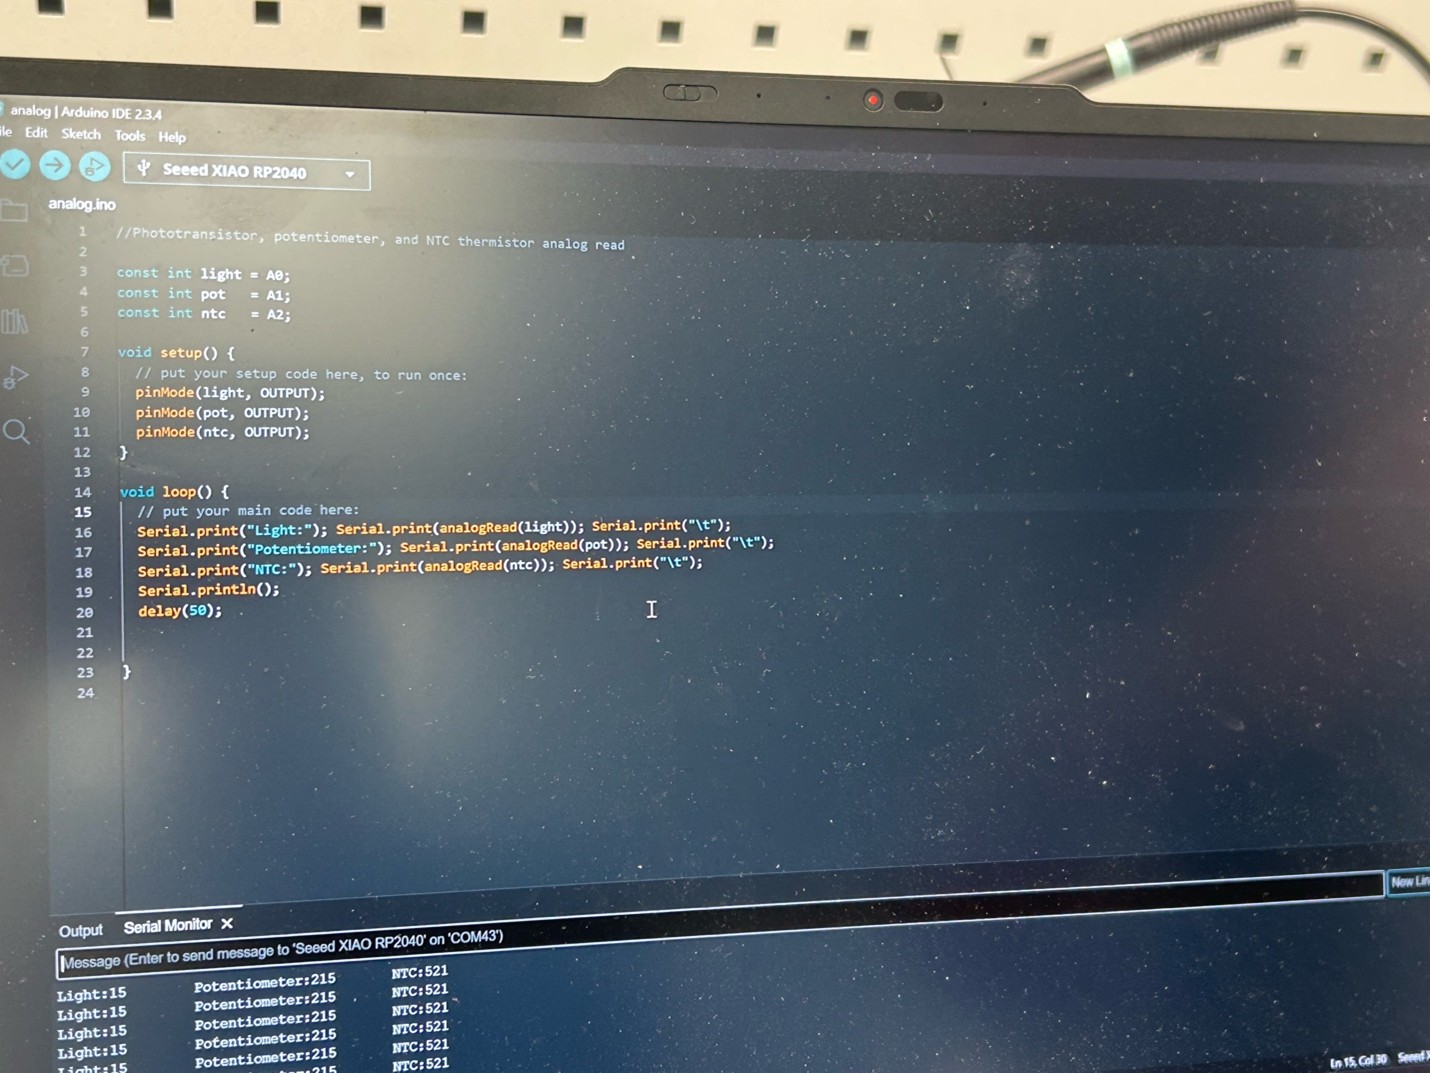
The microcontroller was programmed to read analog data from multiple sensors and transmit the values to the serial monitor for observation.
Serial Monitor Data Interpretation
The Arduino Serial Monitor displayed sensor readings in real time, for example:
- Light: 15
- Potentiometer: 215
- NTC: 521
Explanation of values:
Light: 15
Value read from the light sensor at analog pin A0. A very low value → indicates a dark environment or minimal light exposure
Potentiometer: 215
Value from the potentiometer at pin A1 Represents a low-to-mid range position of the knob
NTC: 521
This is raw analog value from the temperature sensor (NTC thermistor) at pin A2 This value is not the temperature in °C (further conversion is needed).
Oscilloscope Observation of Analog Signal
This is the oscilloscope's analog signal read from the light sensor. The horizontal axis is the time and the vertical axis is the voltage.
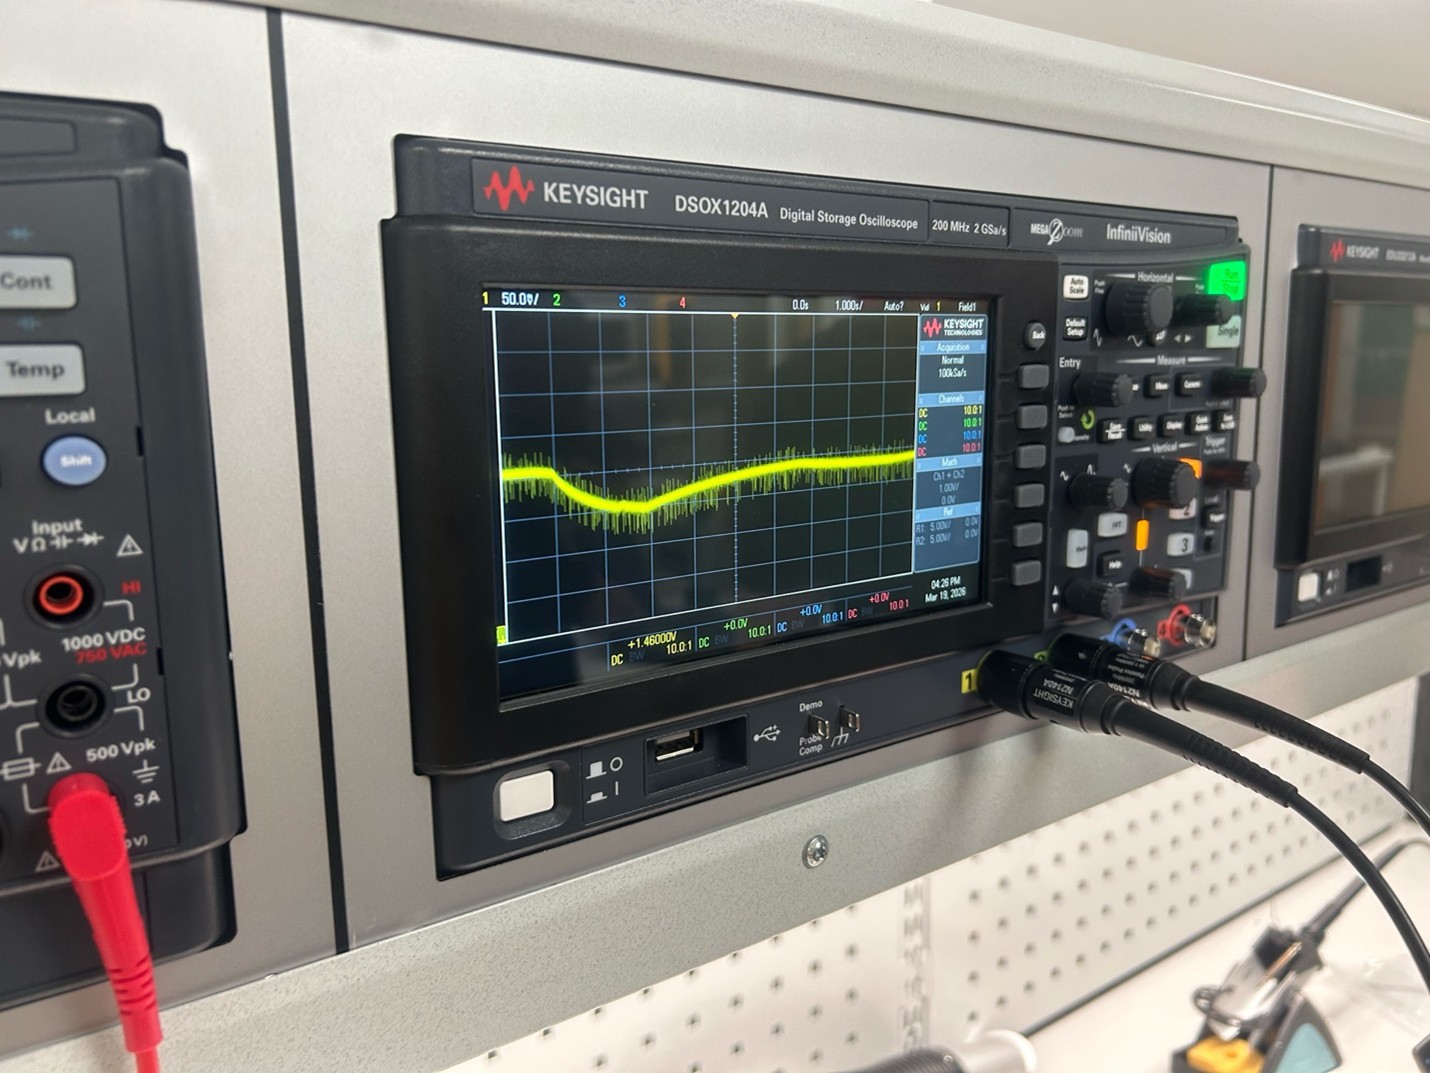
These values are analog-to-digital converted (ADC) readings, typically ranging from 0 to 1023 for a 10-bit ADC.
Signal Characteristics
Signal type: Analog DC signal
Voltage level: approximately 1.46 V, slowly varying over time
Noise level: minimal
Vertical scale: 50 mV/div
Horizontal scale: 1 s/div
The signal is relatively stable with minor fluctuations, indicating a consistent light level.
4. AI prompt
At the time I add this part, it has been a few months since we finished this documentation. Thus, I cannot find the link to the conversation between us and AI. Below here is the prompt that I remembered I sent to AI:
I am documenting a Fab Academy group assignment for 'Input Devices' week. We conducted two experiments: one observing I2C digital signals (SCL and SDA) from a Time of Flight sensor on an oscilloscope, and another observing analog signals from a light sensor, potentiometer, and NTC.

Please help me structure a professional report that:

Explains the fundamental differences between Analog and Digital signals (Sine vs Square waves, noise sensitivity,...).

Describes the I2C setup, explaining the roles of SCL and SDA.

Interprets the raw serial monitor data (0-1023) as 10-bit ADC values.

Formats the oscilloscope observations including scale (mV/div) and signal stability.

Use Markdown with clear headings, tables for comparisons, and placeholders for our images.
However, after we received the answer from AI, we did edit it to fit with our group work.